


Since the version 16.1.0.0 of HarePoint Analytics for SharePoint 2016 and version 15.6.0.0 of HarePoint Analytics for SharePoint 2013, the new great feature is available: now it is possible to include any custom fields from Active Directory or SharePoint User Profile, so that you can have those fields displayed in reports, as well as you can filter or group reports by that fields easily. This makes HarePoint Analytics reports even more flexible and informative. A large set of brand new reports can be created using this functionality. Below you can find a brief description of how to configure and how to use this new feature.
Enabling data collection for custom fields
There is a large number of fields available both in Active Directory and in SharePoint User Profile. It is important to note that by default, HarePoint Analytics is only collecting data for some basic fields (such as Department, City, Title, E-Mail, etc) and not collecting data for any other fields until they are selected in the settings.
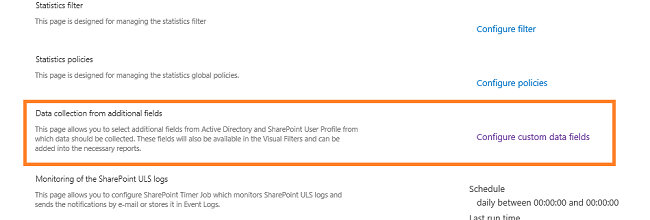
That is, data collection for a custom field starts after the field is selected, and stops when this field is removed from the settings. In order to manage the data collection for the custom fields, go to Central Administration – Monitoring – HarePoint Analytics settings – Data collection from additional fields:
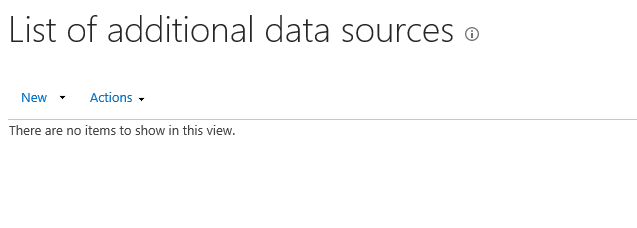
By default, no custom fields are selected:
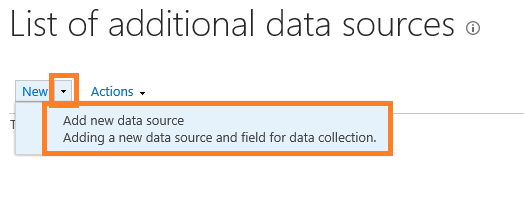
To add a new field, click New – Add new data source:
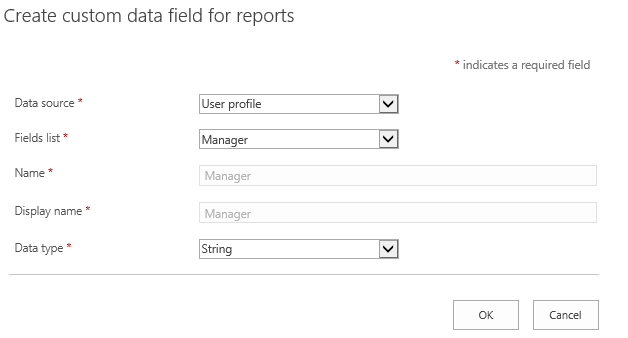
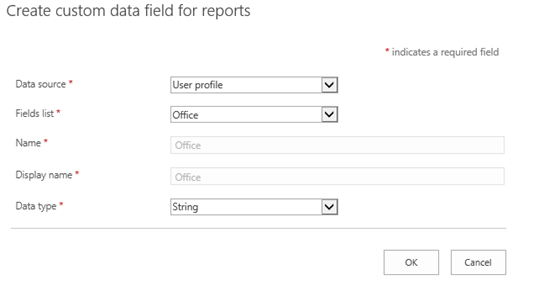
A form will open, where you can select any field either from Active Directory or from SharePoint User Profile:
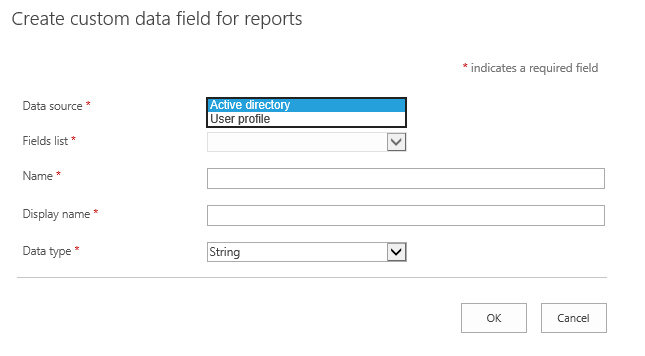
In this example, we are adding Manager and Office fields from User Profile:
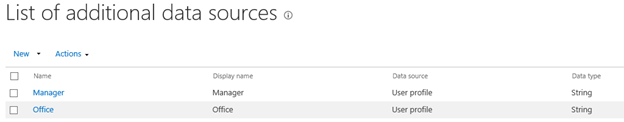
Now, both fields are displayed in a list, and (which is especially important) data collection for them has now started:
Note: consider to include only the necessary fields, to prevent excessive database growth. For more details, refer to HarePoint Analytics Admin Guide.
Using custom fields in reports
Viewing, sorting and grouping
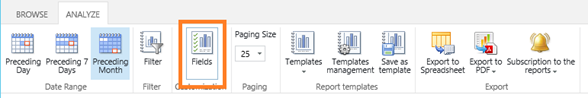
Immediately after the fields have been selected in HarePoint Analytics settings, they become available in reports. These fields, however, are not displayed in a data grid by default, so you would need to enable them using Fields button on a ribbon:
As you can recognize, the two newly added fields are at the end of the list:
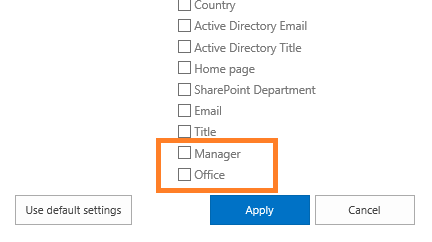
Select these checkboxes, then click Apply, and the custom fields are now displayed in a data grid:
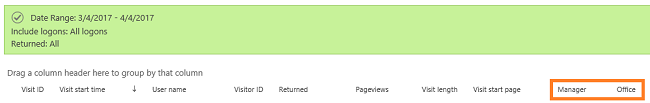
Note: the data in these fields will appear only after the data processing is completed. This depends on the schedule of HarePoint Analytics timer jobs. With the default schedule, the data will appear on the next day.
The columns for custom fields act as any other regular column in HarePoint Analytics report, so you can do the following:
- drag-and-drop these columns to reorder them as necessary
- sort by these columns by clicking on them
- group by these columns by dragging the column header above the table
For more details, please refer to HarePoint Analytics User Guide.
If you export a report that contains the custom fields, the output PDF or XLS file will include these fields as well.
Filtering
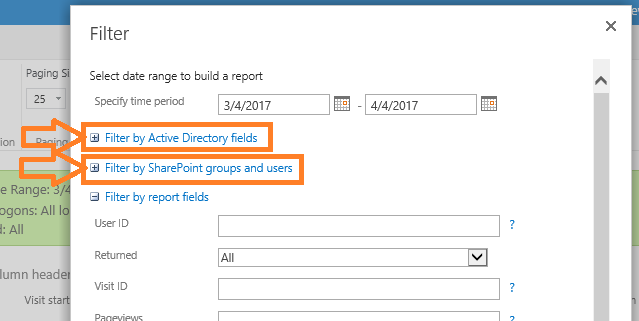
The custom fields are also available for filtering – click Filter button on a ribbon. The fields can be found under the corresponding sections – fields from Active Directory are under Filter by Active Directory fields, and fields from User Profile are under Filter by SharePoint groups and users:
In our case, the newly added custom fields are displayed under Filter by SharePoint groups and users:
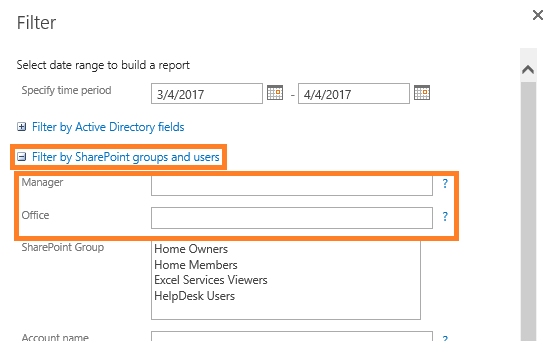
Now, you can filter by these fields right as by any other fields.
Note: filtering will be possible only when the data processing is completed and there are data displayed in these fields in reports. This depends on the schedule of HarePoint Analytics timer jobs. With the default schedule, the data will appear on the next day.
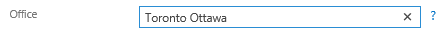
For example, to see visits only from Toronto and Ottawa offices, type Toronto Ottawa to the Office field:
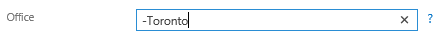
If you want to see all visits, except from Toronto office, type – Toronto (begins with minus sign):
For more details, please refer to HarePoint Analytics User Guide.
Conclusion
The new feature to add custom fields from Active Directory or SharePoint User Profile makes the reporting capabilities in HarePoint Analytics even more outstanding. You can now enrich the existing reports with the additional data you need, and even create brand new reports by grouping or filtering by the new fields.