Practical and effective analytics solution for sites based on SharePoint Online. Get the complete insights and usage analytics to drive your productivity and optimize employee engagement.
HarePoint Analytics for SharePoint Online can also be deployed as Azure Managed application right in your own tenant, allowing you to keep everything in your environment and pay for it as part of your existing Azure subscription.
Analyse, plan and develop your SharePoint Online environment with all the insights provided by HarePoint Analytics:
Users
Number of users accessing your sites
Visit details: Geodata, device, OS, etc.
User behavior including referrer and exit page URL
Search requests, search results, and follow-up paths
Detailed user-activity report
Content
Content popularity across sites and site collections
Obsolete data that haven't been accessed in a particular period of time
Document version control
Site and storage growth control
Historical data - see moved/deleted files
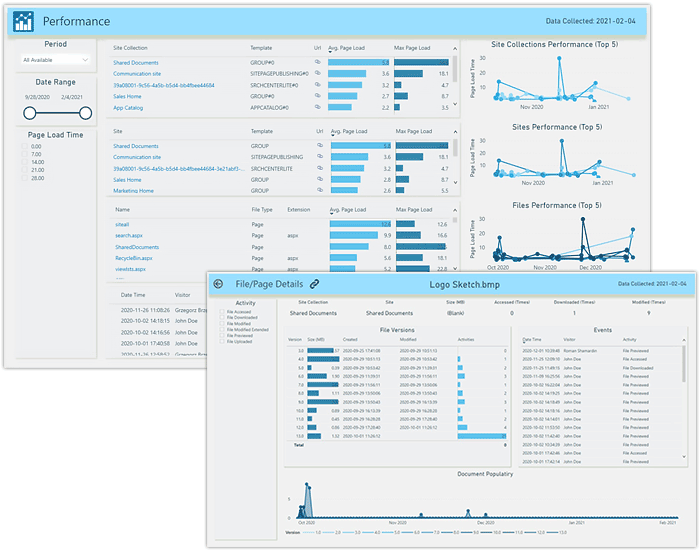
Site performance
Average search time for each user request
Average and Maximum page and document load time
Drill-through to troublesome item
Performance dynamics during selected period
Site collection/Site/File level controls
Features of HarePoint Analytics for SharePoint Online
Deep integration with Power BI gives a comprehensive and visually appealing look to all the reports and analytics data
Ready to use dashboards and reports to start data analysis immediately
Drill-downs and cross-linked reports across sites and site collections give you an in-depth understanding of exact user behavior, document or site usage, and visits patterns
Accumulate analytics data to help to do a deep behavioral analysis and to prepare effective development strategies
Send reports to your colleagues by email on a schedule
Filter, group, export data to see exactly what you need
Easy deployment, the highest security level; no special training for your staff
Take a look inside HarePoint Analytics for SharePoint Online:
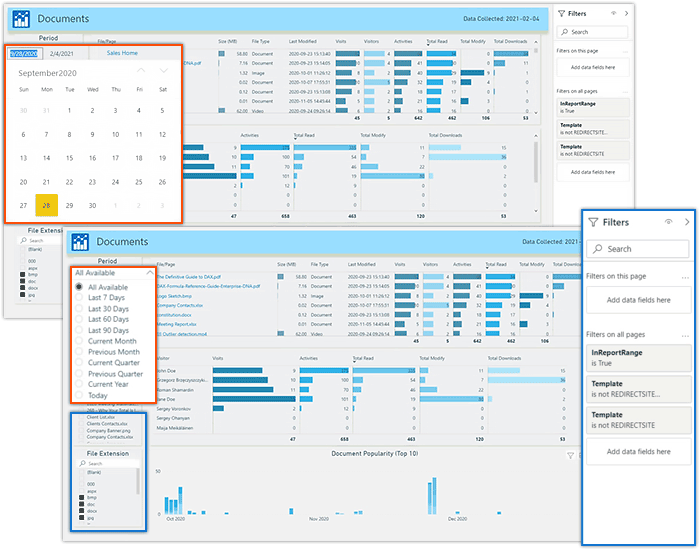
Precise data range selection and filters
Use our data period presets and fine-tune them with the data-range selection slicer and a calendar picker. You can bookmark your selection and set the tuned data as a default template in your Power BI. Using our filter pane together with the powerful filtering capabilities of Power BI you can create a dashboard that suits your needs perfectly.
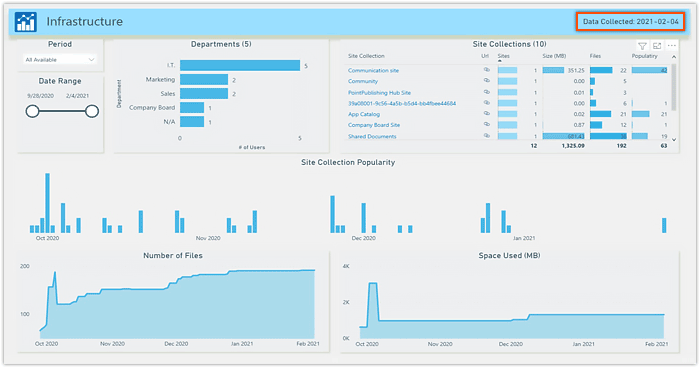
General overview of the company infrastructure
Quick company infrastructure overview for the current date will give general information about the most essential data: Number of site collections, Size of the storage used and its dynamics, popularity trends of your site collections, and other important data.
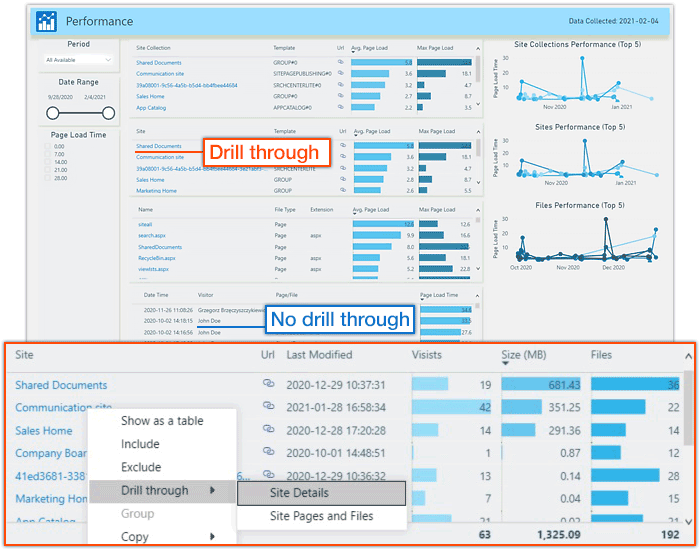
Intuitive Drill-through fields
It is hard sometimes to determine drill-through or cross-report-enabled fields in Power BI. We’ve highlighted those fields so you don’t need to look for little Power BI pictograms to determine the fields with further details. Just right-click the highlighted fields and you will see all the drill-through levels possible.
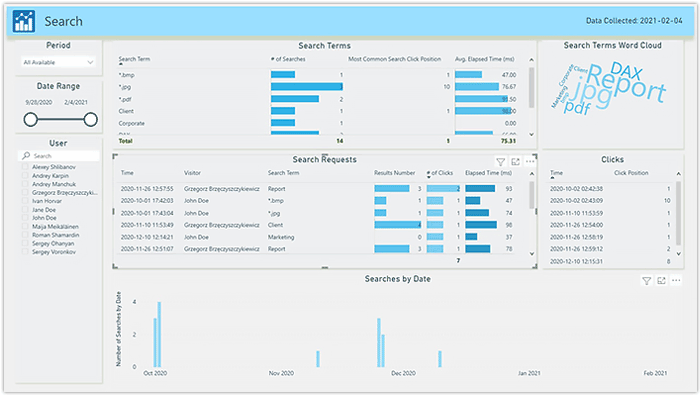
Advanced search analytics
Detailed reports on the search activity of your users will give you a clear understanding of the structure of your site. You will see what users are trying to find on your site and will see how successful their search is. Based on that information you can optimize your website to make the most popular topics easily accessible.
Detailed activity reporting
You can see the site popularity trend as well as visitors’ activity (visit path), devices used, Browser name and version, OS, Geodata, visit durations and much more. Drilling down further will reveal the details about files and documents on the site. You will see full information about the document including the version changes, who and when had modified, downloaded and read the document, etc.
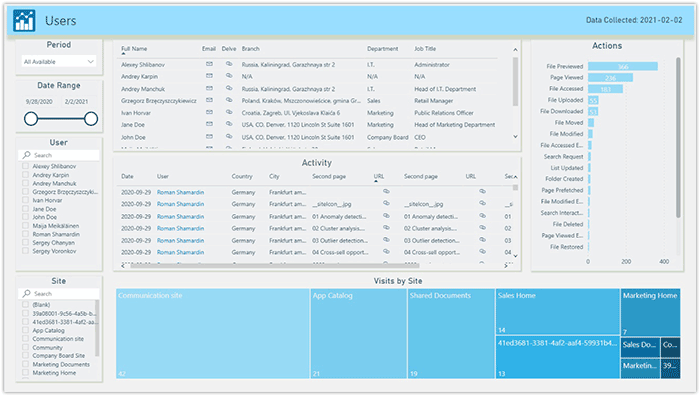
Full User details
See the full information about SharePoint users in your infrastructure including contact information, Job title, Department and Users' actions. You can see the most visited Websites and the most popular actions that your users perform across your site collection. You can also drill-down to more detailed user information by right-clicking the highlighted fields.
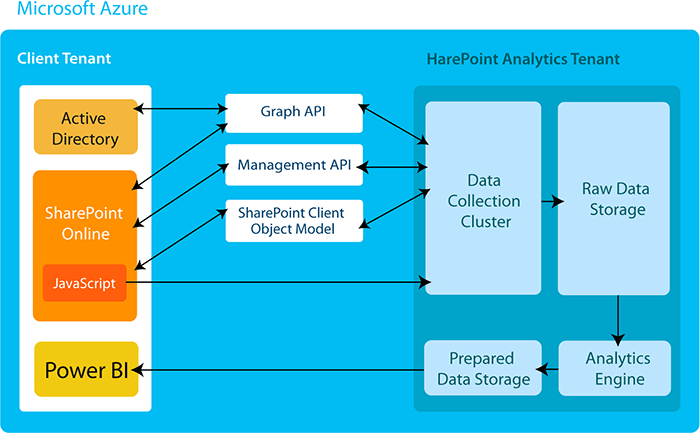
Usage Data Collection and Processing
SharePoint Online usage data is collected with the help of Graph and Management APIs, SharePoint Client Object Model, and a special JavaScript tracking code. Later, this information is processed by the HarePoint Analytics engine to be available in detailed Power BI reports and dashboards.
Next actions to start using Analytics for SharePoint Online