


In the context of SharePoint, the goal of any campaign is to bring visitors to the site and convey a message to them through the site. The campaign can be carried out either online, or offline, for example, as an industry expo, or a seminar for employees. In any case, with HarePoint Analytics, we can evaluate its results.
While assessing the results it is important to identify the following factors: what audience we have won as a result of the campaign, how interested is that audience, and how well the expectations of the audience were met, in other words, how well the campaign hit the target. If we are able to express these estimates in numbers, in future we will have a basis for comparing the effectiveness of different campaigns.
Offline campaign
Suppose we arrange a bike ride for our employees, we placed an advertisement about this event in the hall of an office building and invited everyone who wants to participate to visit the site health.company.com.
To estimate how many people are interested in an advertisement, you can use report “Visits trend”, showing the overall dynamics of site visits:
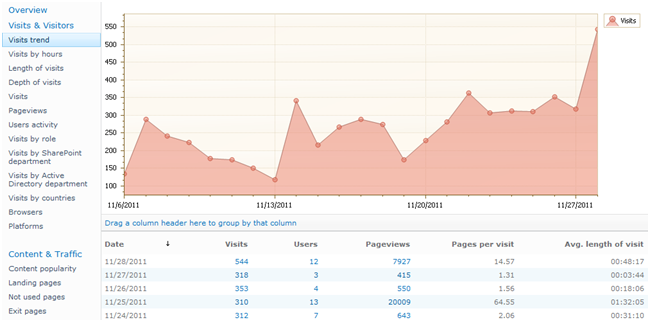
Now the time of the most interesting question has come. How much were people interested in the proposal or how well did the content meet their expectations? As an estimate, we can take the time spent on the site and the depth of viewing. We can get the data from reports “Length of visits” and “Depth of visits”. Most of those who came because of curiosity are likely to quickly view a single page and close the site. Those who are really planning to take part in the race, will read more information – read the route description, information about meals for participants, the program of celebrations after the race, etc.
There are no common metrics of what values of the length and the depth of viewing are considered to be good and what are bad. That is because absolute values are very dependent on the topology of the site and the number of pages on it, and on the reason, people come to this site. On the one-page business-card site with only the name and the contact phone number of a person, the depth of viewing will never be different from 1. You can estimate these indicators based on common sense. “Why 80% of visitors view only one page and are not interested in others at all – with a description of the route and the program of celebration?” The depth and the time of viewing are often called the index of the audience quality.
You can also use report “Visits by Active Directory department” or “Visits by SharePoint department” to understand how the interests of various groups and their behavior differs on the site. If SharePoint has group Bikers, uniting amateur bicyclists, you can use report “Users activity” with the filter on this group to find out the average length and time of the visit of the group members. Comparing the indicators of different groups will help you understand how and with what you can attract “lagging” groups in the advertising campaign or on the site.
And the final estimate in the study is the numerical evaluation of progress. For a bike ride, it can be the number of registered employees. For an information project, it can be a number of replies received in the discussion or the voting or the number of downloads of the document. When creating a site it is very important to think in advance what you will assess as a result of the campaign study. For example, you can put all the information about the bike ride on one page. But if you put information about the route in a form of a separate document, the number of downloads can give you an excellent rate of interest of the audience.
Many objects on the SharePoint site, for example, the libraries of documents, polls, blog posts, in fact, are lists of different visual representations. HarePoint Analytics offers a number of reports on lists of SharePoint. Report “List growth trends” with the filter on the selected list can give a clear idea of achieving the ultimate goals of the campaign, pointing to the fact how many members signed up for the bike ride:
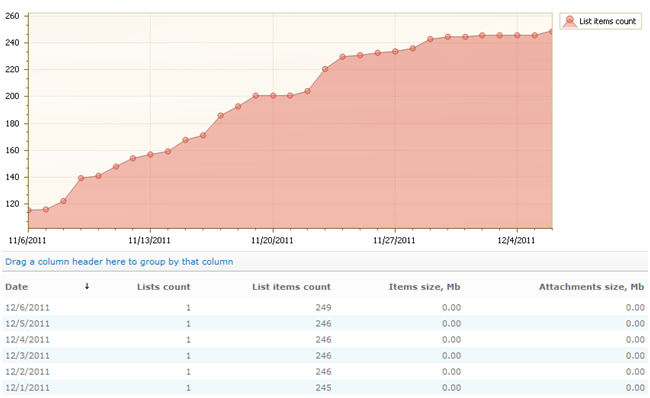
If you carry out several campaigns separated by time, this graph can be an excellent illustration of the effectiveness of different campaigns.
Campaigns in the Internet
If you advertise your site on other sites in the Internet or a corporate network, you can accurately determine how many visitors have passed to you from other sites and how much they are “qualitative” (how long they are on the site and how many pages they view in average). You can use report “Traffic Sources”:
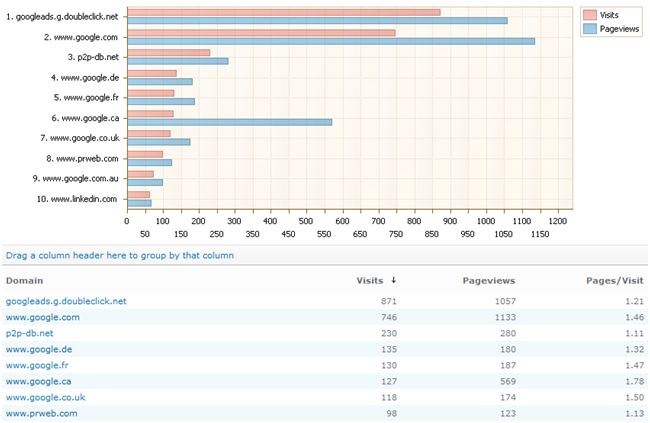
You cannot always easily tell why the audience quality of two similar sites varies significantly. For example, one site is working for a long time, has a permanent audience and is hardly advertised. The second site appeared not so long ago, does not have a permanent audience, and receives visitors by advertising. The audience of the first site – people who are seriously interested in the materials presented on this site. Audience of the second – basically random curious people, it didn’t have enough time to form the audience core. The number of visitors from these two sites on the advertiser’s site may be the same, but their behavior is strikingly different. There can be plenty of such examples, so believe not the media kits, but the statistics, which truthfully tells who actually comes to you.
Sometimes you should make a separate page for advertising campaigns on the site. First, it allows you to better formulate your proposal on the page for people who are attracted through the advertising campaign. Secondly, it allows you to separate this audience from the rest audience of the site. Reports “Content popularity” and “Landing pages” allow you to compare the response to the proposals on different pages of the site and to optimize the text on the pages:
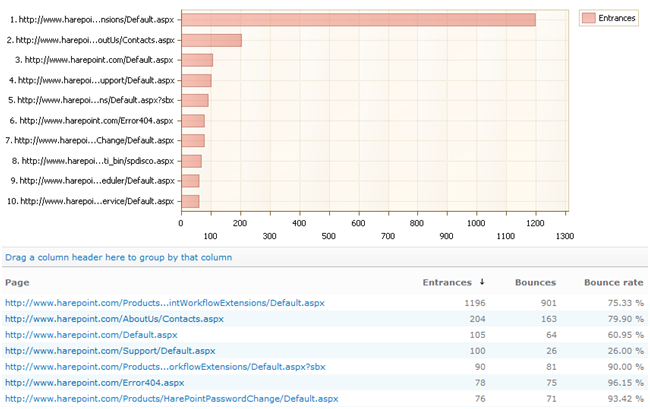
“Bounce rate” means the percentage of visitors who immediately closed the site after viewing the page. The absolute value is very individual for different advertising campaigns and different sites, but if 9 out of 10 visitors closed the site immediately, it is a serious reason to think: either the audience is perfectly not yours, or you offer people something that completely differs from what they want to see.
Conclusions
There are many techniques of analysis and a set of indicators in modern marketing. But once you learn to freely operate such indicators as total traffic, the average number of pages viewed and the duration of a visit, understand how they are connected to each other on your website and are able to evaluate and compare the quality of audience attracted as a result of various promotional campaigns, such SharePoint statistics knowledge will be sufficient to significantly increase the efficiency of budgets and resources spent on a project.