


Adding Google Analytics to your SharePoint website
 This article is available in German: SharePoint & Google Analytics. Warum sollte man spezialisierte Lösungen wählen?
- Get the code to be inserted into the <head> section
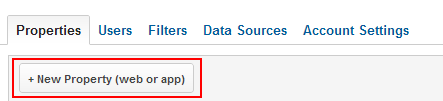
To do this, go to the Google Analytics Admin section

Select the account to which the new website will be connected; click the button to add a resource:
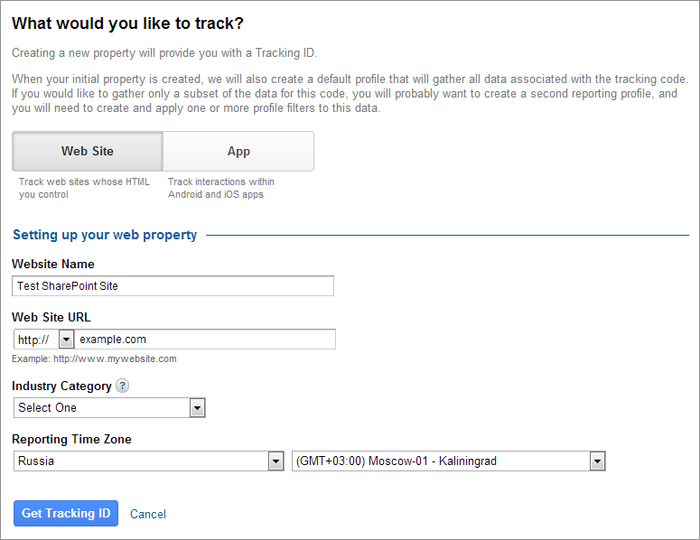
Configure the settings for the new SharePoint site:
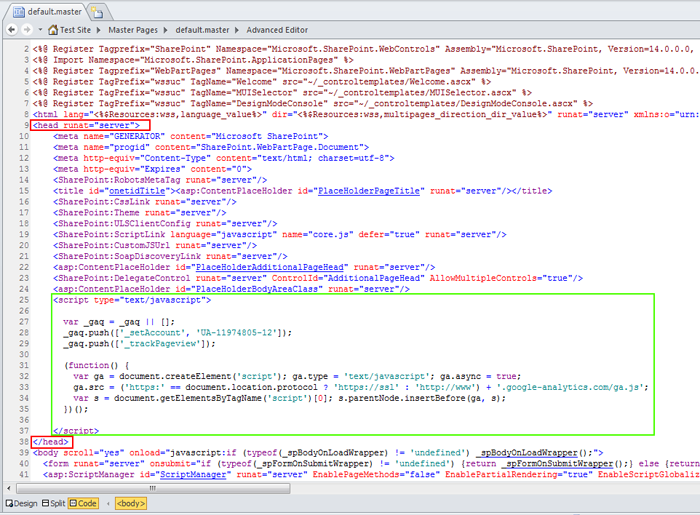
Get the code to be inserted into the <head> section:
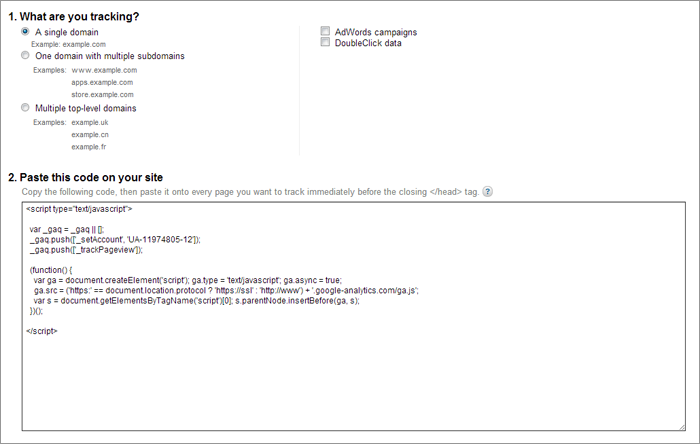
- Paste the code into the pages on the Master Pages tab using Microsoft SharePoint Designer.
In Microsoft SharePoint Designer, open the control panel of the site, to which Google Analytics will be added. Select Master Pages on the Site Objects panel:
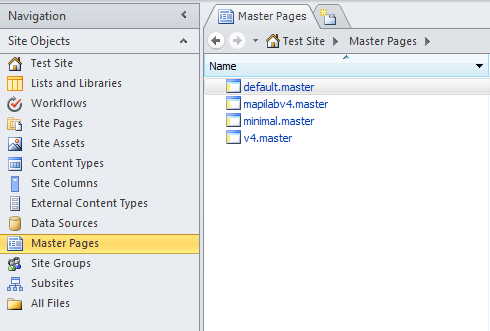
Edit the HTML code of all master pages that are in use: paste the Google Analytics code into the <head> section.
What are the advantages of Google Analytics?
After adding of the Google code to the master pages, the system starts collecting the data on visits to your site.
The statistical system allows you to get a lot of information about the site traffic. Were the visitors active? What browser are they using to work with your site? How did they navigate through the site? Where did they come from? What were they looking for? Did they find the desired content?
Why is it better to use specialized solutions for a SharePoint site?
One of the main purposes of SharePoint sites is teamwork. Every user who works with documents on a SharePoint site has an individual account containing specific data such as department, group, etc. Google Analytics uses JavaScript to collect data directly from the page being loaded as well as from the user’s browser. The system does not put additional load on the SharePoint server but it does not process the user data either, making it more difficult to work with tasks that are specific to SharePoint. However, such specialized solutions as HarePoint Analytics for SharePoint can provide these data “out of the box” as they retrieve them at the stage of creation of the requested page on the server. Thus, specialized solutions are able to process the internal data of the portal upon the creation of statistical reports.
Working with user data
Using HarePoint Analytics you can view the statistics of visits to your site and divide users into categories according to data from their accounts (department, group, etc.).
You can view the activity history for a certain user or a group of users.
Working with document libraries and lists
In order to answer such an obvious question as “Who downloaded the document?” one will have to perform a lot of non-obvious actions. One of the simplest methods for tracking file downloads in Google Analytics is to assign a JavaScript event to the URL of the downloadable file: the event will trigger a notification upon each download.
In addition, there is still a problem with the identification of users.
As for specialized solutions such as HarePoint Analytics, the file access statistics are provided “out of the box.” You can immediately find out, for example, who worked with the document, which department uses a specific list more often, or how many times the document was downloaded.
Security policies and independence
If you are using a specialized solution, the information on your portal stays on your portal. Statistics are not sent out of the network, the system is independent of any third-party resources. Therefore, these solutions can work without any connection to the Internet on both the server and the client’s side.
Summary
The advantages of Google Analytics:
- Free of charge;
- No additional load on the SharePoint server;
- Search query data.
The advantages of specialized solutions (for example, HarePoint Analytics for SharePoint):
- Easy deployment and deep integration;
- The product was designed specifically for SharePoint, and it is being improved in order to optimize the interaction between two solutions;
- Working with SharePoint internal data;
- Precise identification of users; division of data into categories according to the structural units of the organization;
- Advanced statistical data on the use of document libraries and lists that are simple pages for GA;
- All statistics remain within the organization;
- Individual technical support.