


Integrating analytical data on pages opens up great opportunities for site owners and visitors, of which many are often unaware. With the help of web-parts HarePoint Analytics, you can integrate analytical data on the page literally within one minute.
This article will give you some ideas of how to improve not only the effectiveness of SharePoint sites but also the efficiency of visitors with minimal effort:
- How to improve collaboration on projects and reduce costs of communication.
- How draw users’ attention to important and new documents.
- How to provide simple and effective feedback to the owner of the site.
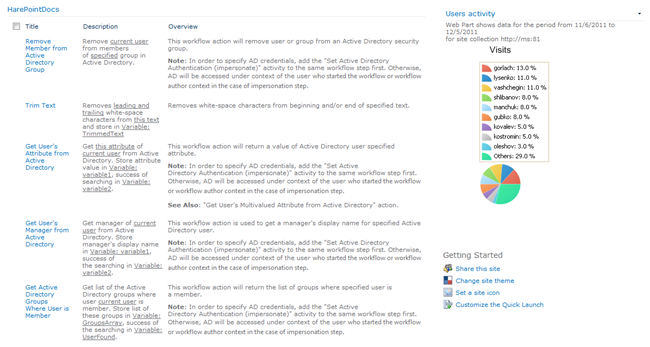
Who is here?
Portals of some companies incorporate thousands of sites – knowledge base, staff blogs, document storages, sites for collaborative work on projects. How can an employee on their first visit to the site quickly find out who participates in the project? The web-part showing the most active users for the last week or month will help to quickly find colleagues involved in the project.
What’s new?
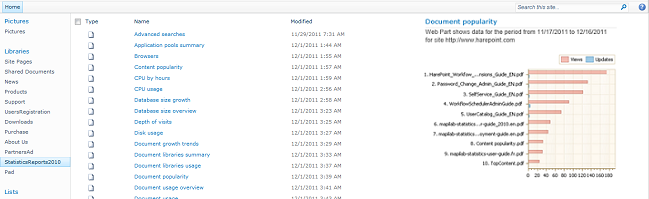
If you are reading the blog, the question “what’s new” is no longer valid. But what if the site contains a document library, with which many employees work? Even sorting the list of documents will not give you an answer, which documents were demanded the most this week.
The easiest way to show the list of the most popular instruments is to add a web-part with report “Document popularity” to the site page. Now, all visitors will see the list of the most relevant documents.
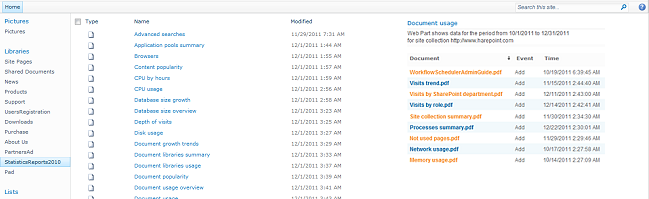
It is also easy to add a list of new documents in the library to the site, so it immediately caught the eye of all visitors. To do this, you can put a web-part with report “Document usage” with filter “Add” by field “Event” on the web site.
What’s happening?
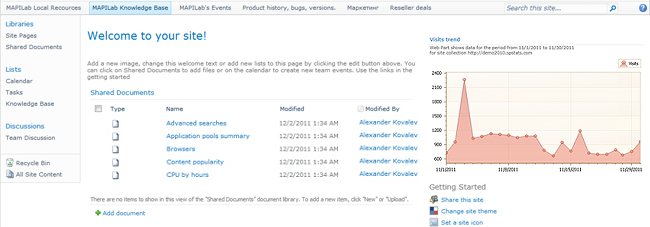
For many website owners low traffic is a surprise. If the site is not maintained by an IT-specialist, then watching its statistics may become a heavy burden and the need to advertise it within the organization becomes a real surprise for people. As an excuse you can hear perfectly sincere words from site owners “Every day I add news, I do not know why nobody reads them there.”
Place the graph of site traffic directly on the main page using a web-part with report “Visits Trends”. Now the owner of the site will always be aware of the true popularity of the site, will be able to evaluate the effectiveness of his work and promptly understand if he does need assistance in promotion.
Conclusions
Usage of the web-parts for publishing graphs and data from reports HarePoint Analytics is a very simple way to inform visitors and site owners on the traffic of the resource, active participants of projects and events taking place on sites. Configuring the web-part takes only a few minutes, but can help to save hours and days, and to increase the efficiency of using SharePoint technologies in the organization.