


Analytics in Microsoft SharePoint enables you to see details about pages of your site as well as about site visitors, so SharePoint reporting is a key point for ongoing site development and improvement. Broadly speaking, there are 3 areas in which analytics can influence site management: content publication; content usage; and general optimization of site pages.
In this article we’ll discuss SharePoint 2010 reporting, as this edition is the most popular platform in the on-premise family of SharePoint products.
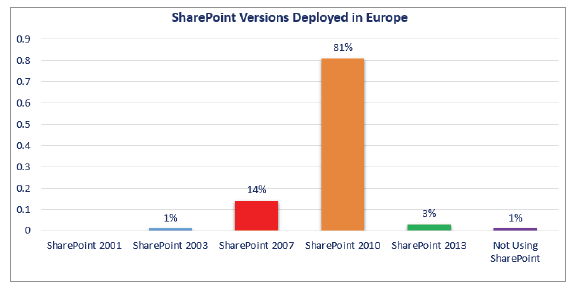
Figure 1: Distribution of SharePoint deployments in the top 10 European markets (source: European SharePoint Community)
The standard reporting features in Microsoft SharePoint 2010 are built on the Web Analytics SharePoint 2010 service. We will briefly review its metrics.
A general understanding of how SharePoint 2010 reporting works includes a few basic facts. First, reports provided by this service are available for different scopes: site, site collection, web-application and farm-wide. Secondly, metrics are available through 2 types of reports: trend reports and rank reports; the first shows specified data for a defined period of time and the second shows the top 2000 results of specified data.
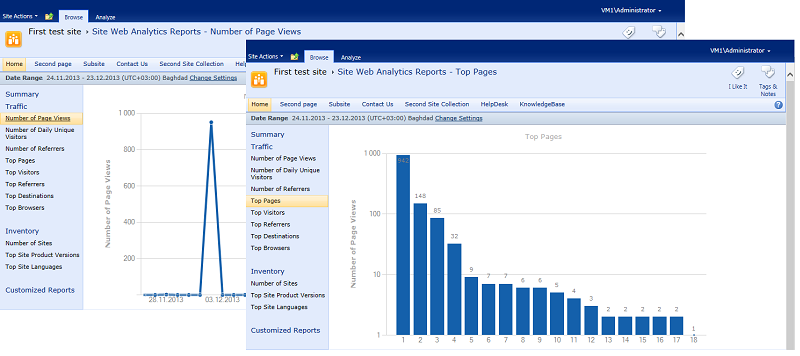
Figure 2: Rank and Trends reports in Web Analytics SharePoint 2010 service
Reporting intervals are set for 25 days by default, but they can be set as long as 25 months if required. A range of simple filters are available in the reports: URL match, user name, user browser, etc. More detailed information about reporting features in SharePoint 2010 is available in an article entitled Introducing Web Analytics in SharePoint 2010.
SharePoint reporting facilities in SharePoint 2010 include 3 different groups of reports: Traffic, Search and Inventory.
The Traffic group provides reports about user behavior and activity, link usage, most-visited pages and so on. There are 8 different reports, examples being the number of unique daily visits and top pages.
Search reports provide direct insight into user behavior because they capture data regarding usage of SharePoint’s search service. This group contains a total of 7 reports that collect important data such as the number of queries and top queries.
Finally – Inventory reports. Obviously this is vital data for SharePoint admins, not for business users. The four reports in this group show the site structure, its changes, and the state of storages.
The adequacy / insufficiency of reports and their data in different groups is a subject of discussion. But if we consider “absolute values”, so, for example, HarePoint Analytics for SharePoint provides over 80 reports and 9 report groups (compared to 19 reports and 3 groups from out-of-the-box SharePoint 2010 reporting). Also it is important to note that many reports in HarePoint Analytics were created based on feedback and inquiries from users who were looking for more than the out-of-the-box functionality offered by SharePoint reporting. You can see the detailed comparison of HarePoint Analytics for SharePoint and SharePoint reporting built-in service.
There is one point on which particular accent should be made. According to research from the European SharePoint Community, “SharePoint Under the Spotlight. European Market Report 2013,” usage of SharePoint breaks down in the following way:
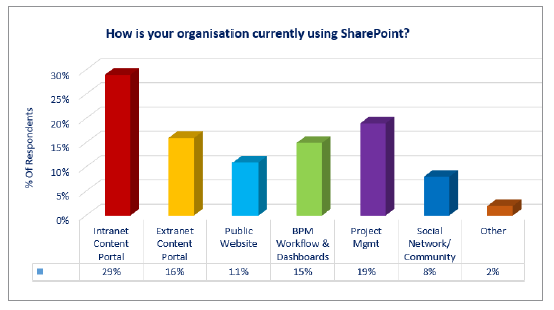
Figure 3: SharePoint usage in organisations
This graph shows that the intranet and extranet content combine for nearly half of the total usage of SharePoint. Naturally the lion’s share of this usage comes from documents in various document libraries.
So how does SharePoint reporting cover usage of documents in portals? The answer in short is not at all.
One of the first and probably the most commonly-asked question by users considering HarePoint Analytics is about document reporting in SharePoint. Document usage in SharePoint is covered, in fact, HarePoint Analytics provides 20 different reports in Documents group.
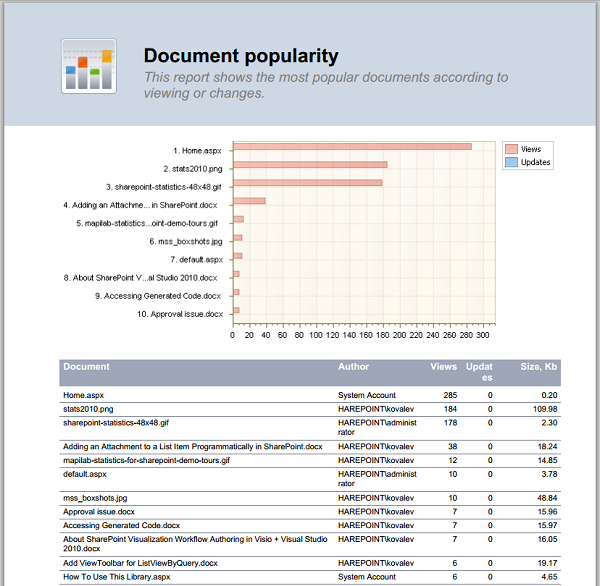
Figure 4: Document Popularity report in HarePoint Analytics
We can conclude that out-of-the-box SharePoint reporting facilities provided via the Web Analytics service in SharePoint 2010 give basic information about site usage, visitors, infrastructure, and tendencies.
However, when viewing these capabilities as a foundation for insight into portal usage, especially in relation to growth and development, it is worth understanding that several parts of SharePoint will simply be blind spots from which no useful information can be gathered. This will greatly limit user satisfaction with the portal as well as the ongoing ability to improve content and its presentation.